What (or who) are the nodes and what are the edges?
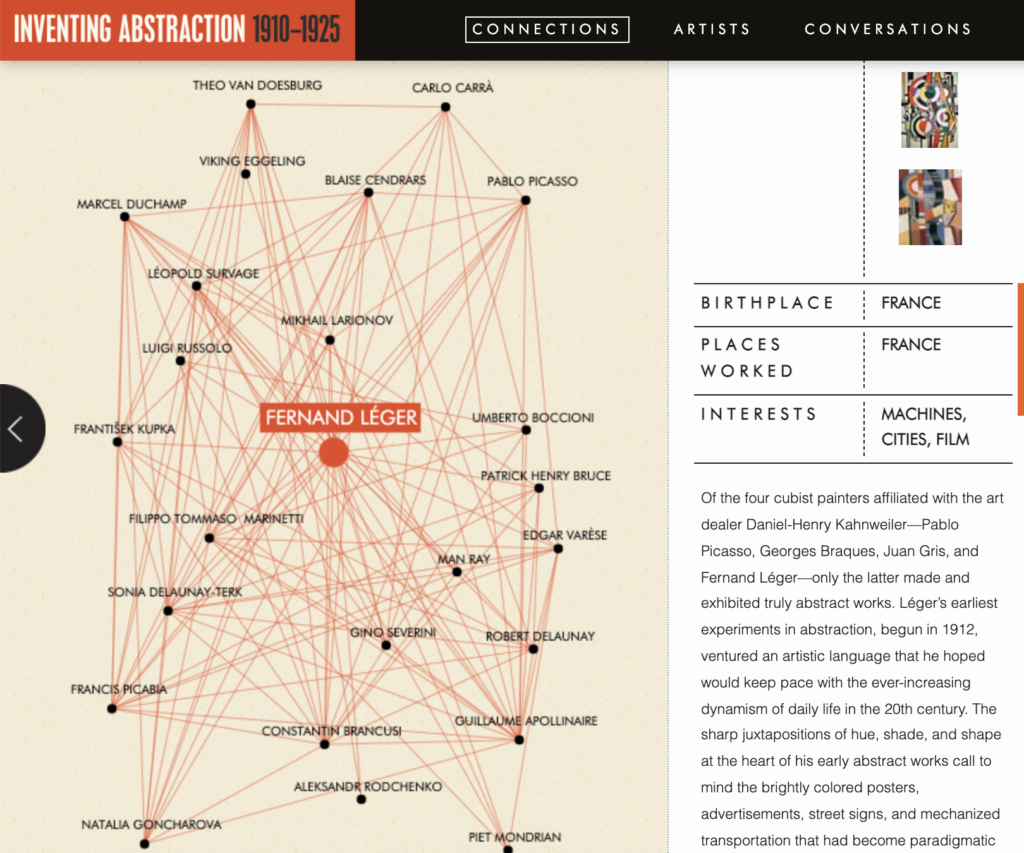
Nodes are the artists and edges are the acquaintances or interactions between the artists during their time.
How are the relationships characterized and categorized?
Relationships are characterized by shared location of activity, artistic interests, or extensive correspondence.
What interactions does the project allow?
The project allows users to select either connections or artists to highlight. Once a user selects an artist, the graph puts the artist in the center and only displays connections that are connected to this artist, making it easier to navigate. On the right panel, users can find a blurb about the artist and some facts about them.
How does this impact their effectiveness and/or your engagement?
Because of the pretty graphics and design, lack of clutter and clever use of a single highlight color, this network graph is highly effective and enticing for users to interact with. Having the authors’ names and the connections in the main graphic and only revealing more details when the user clicks on an artist reduces the cognitive burden placed on the user and makes it less intimidating to click around.
I agree that the simplicity of the graph makes it easier to understand the relationship represented. Also, the color scheme and design make the delivery of information more efficient.
You mentioned that one of the interactive aspects of this network is selecting an artist, which centers them among their interactions with other artists, which can be seen in the picture you selected to show. I noticed in the larger network, where no specific artist is chosen, the visual has some artists as larger red circles and others as smaller black circles. I wonder what you think about this visual effect?