Timelines are incredibly useful tools to visualize data. They allow us to see changes over time and connect related events. I explored the tool TimelineJS first in my Music and Movement in Atlantic World History class. TimelineJS allows you to input events into a google sheets and compile it into their template of a timeline. The presentation of TimelineJS is adaptable and user friendly, as well as it doesn’t require you to know how to code! This is the perfect tool for beginners in the Digital Humanities! I used it in the history context, but so many areas of humanities could benefit from using TimelineJS.
Tutorial
The Knight Lab, which powers TimelineJS, is the perfect place to get started. Follow this tutorial to create your own timeline and make sure to check out the pictures below!
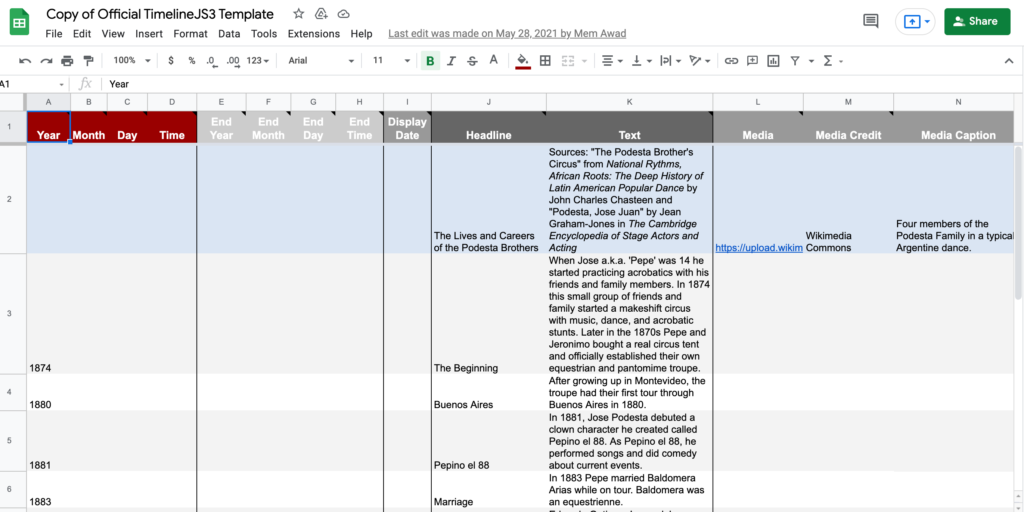
- First create a copy of the google sheets template that they provide on the website.
- Once you know what you want to include in your timeline you can fill in the different columns for each event. If you don’t want to include the information in a column, just leave it blank, as I did for the end year. If you scroll to the right, there are more columns such as background color that you can customize!
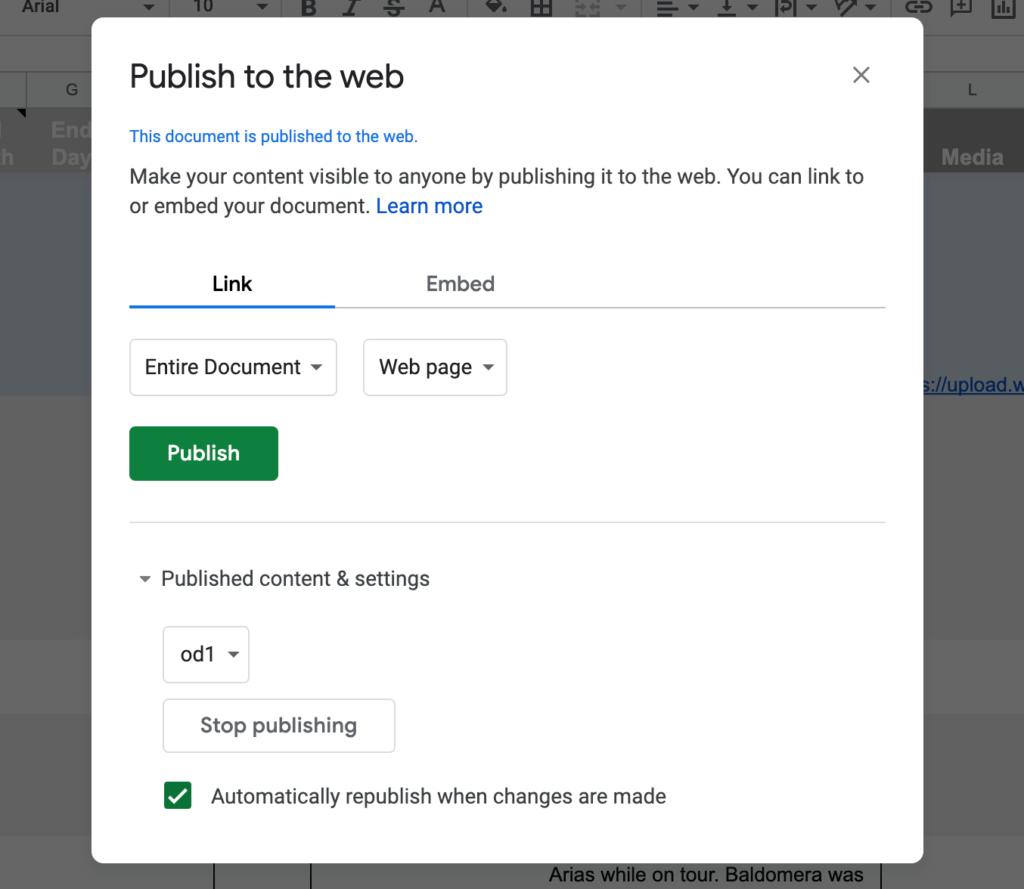
- Click File > Share > Publish to web.
- Then make sure that the published content is the name of the sheet, not the Entire Document. Then click Publish.
- Next, copy the URL of the google sheets at the top of the screen.
- Then, on the Knight Lab website, paste that URL into the box and it will generate a timeline for you! You are provided with an embed code that can be put into your own blog!

Finally, the coolest thing about TimelineJS is that whenever you update your spreadsheet, the timeline will update itself!
Below, you can see the final product of the timeline I created for my history class: