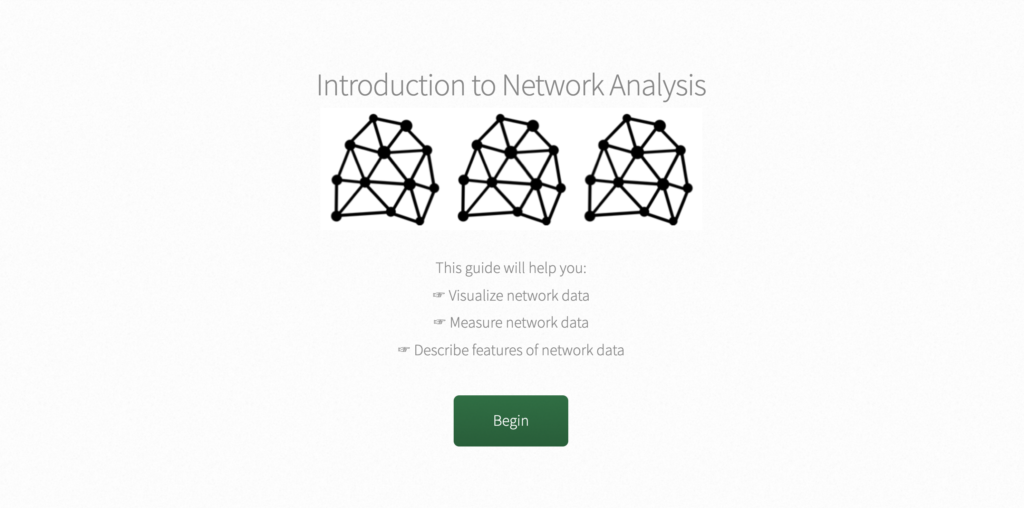
Introduction to Network Analysis is a guide for users to conduct network analysis in Gephi. The website provides example data including information about scholars working in Digital Humanities. Based on the data given by the website, the node refers to anything related to the scholars’ work and research. For example, it could be a person, panel, paper, poster, workshop, university, and etc. The edges connect two nodes that are related to each other. There are not much information about how and why the edges are connected, but we can assume that the edges would connects nodes like a name of the person, and the university that person has attended.
The website gives a step by step guide on how to analyze this data, allowing the users to follow the instructions easily. The website also provides example metrics such as average degree, network diameter, graph density, and eigenvector centrality. The users can use these metrics to the graph to compare them on different nodes.
The website however, does not provide interactive graphs, but only provides screenshots of Gephi, which does not help the users a lot when they are analyzing the data. The project also does not combine network analysis with other informations and techniques. The project shows how to use the program, and how to share the visualizations of the data.
Hi Sunny,
don’t forget to add a picture and add the week 4 as one of your categories. Also add a tag.